Historical Summary
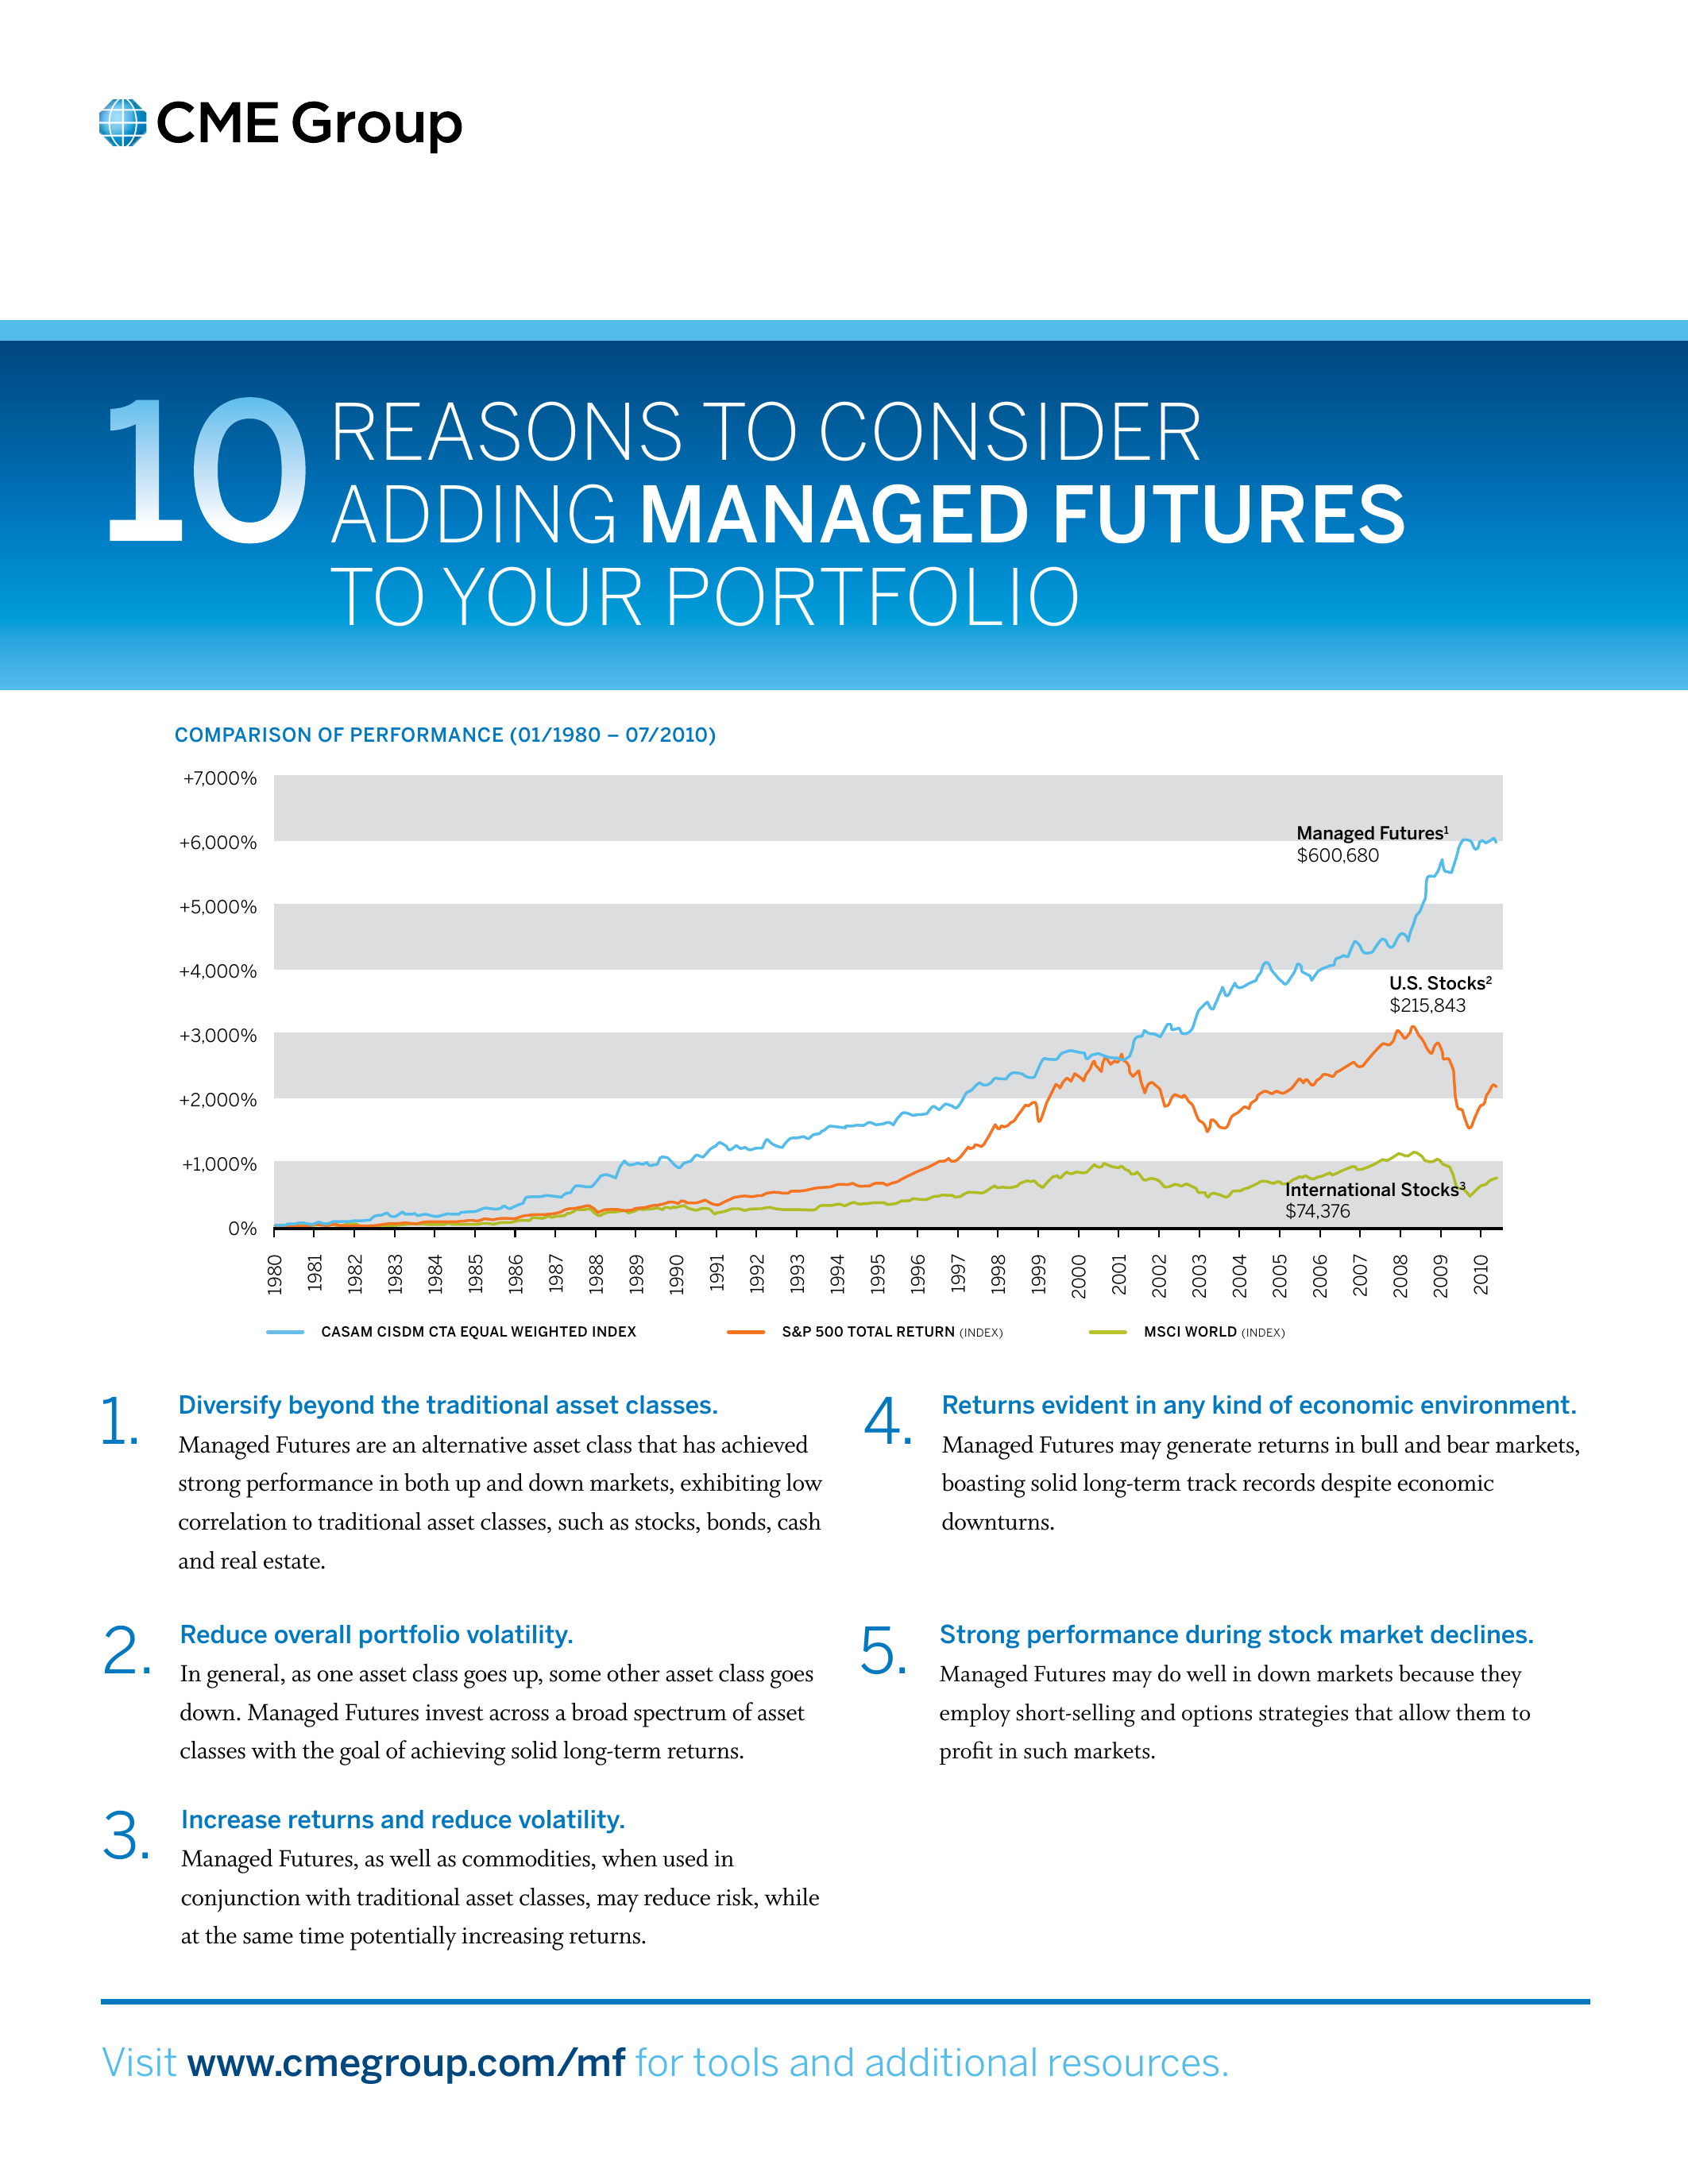
This Chicago Board of Trade publication is an earlier edition of the CBOT’s managed-futures educational booklet titled Managed Futures: Portfolio Diversification Opportunities. It is distinct from AFG-EDU-013 (the 2005 edition, publication code EM 35-2R2): this edition carries data references through mid-2003 and presents updated tables and charts reflecting that period. The cover features the CBOT’s distinctive octagonal logo motif overlaid on composite imagery of a trading floor, grain fields, currency, and price boards. The publication opens with the landmark quotation of Dr. John Lintner of Harvard University on the risk-reduction properties of managed futures portfolios. The body text defines managed futures and commodity trading advisors (CTAs), notes that over $45 billion was under management by trading advisors as of mid-2003 (sourced from Managed Account Reports, MAR), and presents four benefits of managed futures: reduced portfolio volatility risk, potential for enhanced portfolio returns, ability to profit in any economic environment, and ease of global diversification. Table 1 presents the Correlation of Selected Asset Classes 1993–2002 (Barclay Trading Group, Ltd.), with managed futures showing a correlation of −0.19 to U.S. stocks and 0.33 to bonds. Table 2 presents annual Performance of Selected Asset Classes 1993–2002, showing managed futures (Barclay CTA Index) with a compound return of 6.9% versus 9.3% for U.S. stocks and 9.5% for bonds. Chart 1 shows the Potential Impact of Managed Futures on the Traditional Portfolio, January 1980–May 2003. Chart 2 (Worst Case Declines) compares managed futures performance during the worst peak-to-valley drawdowns of the S&P 500 (−15.7%), NASDAQ (−75.0%), and International Stocks (−50.7%), with managed futures posting positive returns of 26.3%, 21.0%, and 23.4% respectively. Table 3 lists the Most Actively-Traded Futures Contracts with trading volume over 10 million in 2002, covering CBOT, CME, Eurex, LIFFE, NYMEX, LME, TOCOM, BM&F, ParisBourse, IPE, KSE, OM Stockholm, SGX, SFE, KOFEX, and Commodity Exchange Japan (CHUBU). The publication addresses the efficiencies of the futures markets (liquidity, transaction costs, leverage), types of investment opportunities (individual accounts, private pools, public funds), and participants in the managed-futures industry (CTAs, FCMs, CPOs, investment consultants, trading managers). It includes a section on evaluating risk from an investor’s perspective, defining standard deviation, maximum drawdown, and the Sharpe ratio, accompanied by Chart 3 (Volatility of U.S. Equities, Commodities, and Interest Rate Instruments, Monthly Price Volatility 1992–2003). A section on assessing performance lists managed-futures indexes (Barclay CTA, MAR, MLM) and commodity market indexes (MLM, CRB, GSCI, DJ-AIGCI℠). The fee structure section explains management fees, performance incentive fees, transaction costs, and the netting-risk mechanism.
Curator’s note
This document is reproduced solely as a historical educational artifact. It was produced by the Chicago Board of Trade and was not authored by Argo Futures Group. All performance figures, portfolio illustrations, market data, correlation tables, drawdown comparisons, strategy descriptions, industry statistics, and risk discussions reflect the original publication period, with data references through mid-2003. They must not be interpreted as current data, current investment advice, a recommendation, a solicitation, or a guarantee. Past performance is not necessarily indicative of future results. Copyright © 1996, 1999, 2002, 2003 Board of Trade of the City of Chicago. All rights reserved. Publication code EM35-2R1 09.03.15000 03-03498.